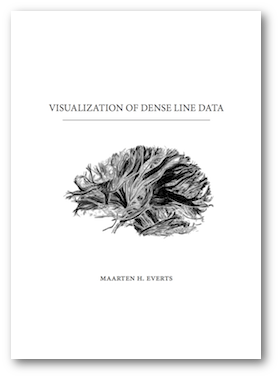
Visualization of Dense Line Data
-
. Visualization of Dense Line Data. PhD thesis, Johann Bernoulli Institute for Mathematics and Computer Science, December 2011. Promotor: J.B.T.M. Roerdink, copromotores: H. Bekker, T. Isenberg.
Download: pdf
Main URL: http://irs.ub.rug.nl/ppn/338810471
Abstract
 This thesis addresses the visualization of dense lines. Such collections of dense lines present themselves in various domains, two of which we describe in this thesis. The first domain is medical science where dense lines in the form of DTI fiber tracts are used to provide insight into the structure of the white matter of the brain. The other domain is numerical mathematics, where streamlines are used to provide information about the structure and behavior of fluids and gases in flow simulations. Naïvely visualizing such collections of dense lines typically results in a cluttered, uninformative view. To address this problem, this thesis provides four contributions for the visualization of dense lines. The first is a fast new method for extracting fiber tracts from DTI data. The main idea is to convert the underlying data to a large graph and to apply Dijkstra's shortest path algorithm to that graph. In the next chapter we introduce a new visualization method for dense lines that is based on traditional illustrative techniques. The resulting visualizations resemble hand-drawn black-and-white illustrations. In the chapter that follows we describe a method for creating abstract representations of dense lines that can help in understanding the global structure. In the last chapter we introduce a flexible line style model for visualizing streamlines.